In August, while on the road moving to Duke, I heard a great interview on NPR with David Suzuki. During this interview he talked about the relationship between anything that grows exponentially and the resources that it consumes. In particular he focused on how we are likely to misperceive the remaining level of resources because humans are bad at understanding exponential growth (see anything by Kurzweil).
I wanted to retell his analogy because it has really stuck with me and then provide a visualization that I found helpful.
Imagine 2 bacteria in a petri dish. The petri dish is many, many times bigger than they are. To keep the math simple lets say that it is 1 billion times larger. The bacteria in the dish look around and realize that they have a bounty of agar on which to live and thus anticipate much prosperity. So the bacteria, being bacteria, replicate. After 1 unit of time (lets say they replicate every minute), there are now 4 bacteria. These 4 bacteria look around and see that they have this vast petri dish at their disposal and thus keep replicating. Since replicating is fun, this goes on for a while. Eventually after 20 turns of doubling in size there are 1,048,576 (2^{20} ) bacteria. They realize that they have used up just more than 0.1% of their resources and there is much rejoicing and still more replicating.
By the time that 29 minutes have passed there are now 536,870,912 bacteria. They have used over half of their resources, but they look around and see that they still have half of them left and it took them 29 turns to get here, so they have to have a little time to figure out how to get out of this mess. On the 30th turn, the population doubles again and now there are 1,073,741,824 and they are out of room. When a population grows by doubling in size, it by definition will go from 50% resource utilization to 100% in one time period. That was both obvious (mathematically) and shocking to me. How fast is the human population growing? How close are we to running out of resources on earth?
Well, if there was any doubt about whether human population growth was exponential here is a graph of estimated growth over the past 12,000 years (courtesy of wikipedia):
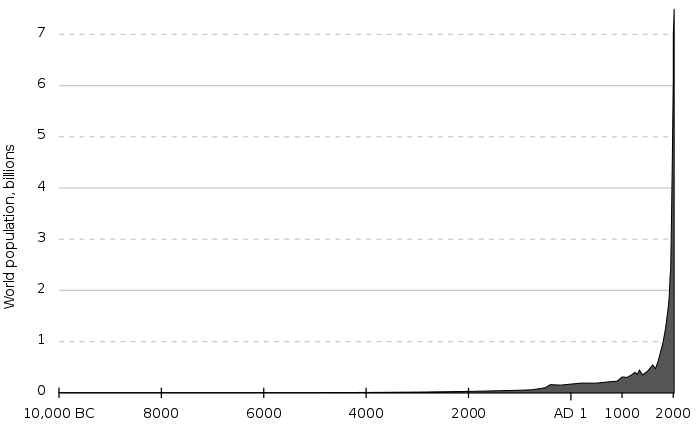
And the CIA factbook estimates the current population growth to be about %1.092 year over year.
Here is a graph that just visualizes the thought experiment proposed by Suzuki:
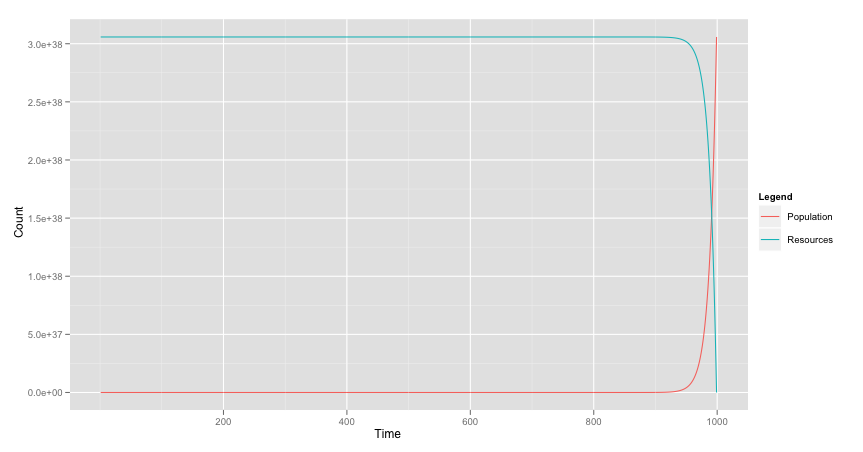
The point of this graph is just to show how quickly the resource level can plunge to zero and how as an inductive species it is easy to fall into the trap of not understanding the rate at which exponential growth can take off by using historical data to improperly predict the future.
Note: For the graph I just picked a time period of 1000 and then decided to drive it to 0 at that point. Given that there is a finite amount of resources you will get the same graph form, one way or the other after fixing the resource size. Below is a gist in R to play around with and see how the curve forms change under different growth rates and how the warning time (as a percentage of the species’ history) shrinks as the size of the resource goes up.